Data Analysis and Visualization
Transforming Raw Data into Strategic Business Intelligence
In the modern digital economy, raw data is not a competitive differentiator anymore. Intelligence is. Organisations harvest millions of records but struggle with the “last mile” of data acquisition: Transforming unstructured complexity into a coherent strategic asset. A database stuffed with pricing logs or customer sentiment is just potential; It remains a liability without rigorous processing.
DataSOS Technologies links raw code to executive decision-making. We unite two distinct but vital disciplines: Data Analysis, which looks at raw data to find out “what and why” behind hidden market trends; and Data Visualisation, which visually communicates mathematical results. Rather than reports, we build interactive business intelligence ecosystems. You get clear, visual dashboards instead of dense spreadsheets, making complicated data understandable for anyone from technical teams to the C-suite. This leads to quicker insight, less confusion & decisions made with action instead of hesitation.
Too Much Data. Not Enough Answers?
You have more data than ever, but decisions are slower. Where meaning isn’t immediate, data becomes a burden. We translate complexity into clarity so leaders can act with confidence.
The Spreadsheet Trap
Does your team spend 20 + hours a week updating pivot tables and repairing broken formulas?
Delayed Intelligence
When you produce a report, has the market already significantly moved by then?
Siloed Data
Do you have marketing data in one tool, sales data in another and competitor pricing in a third?
Invisible Patterns
Are your profits being buried in millions of rows of text, hidden in plain sight and unnoticed?
Data Analysis and Custom Dashboard Solutions
Data that sits in a database is potential; data that drives action is power. We architect custom analytical ecosystems that strip away the noise and force the critical signals to the surface.
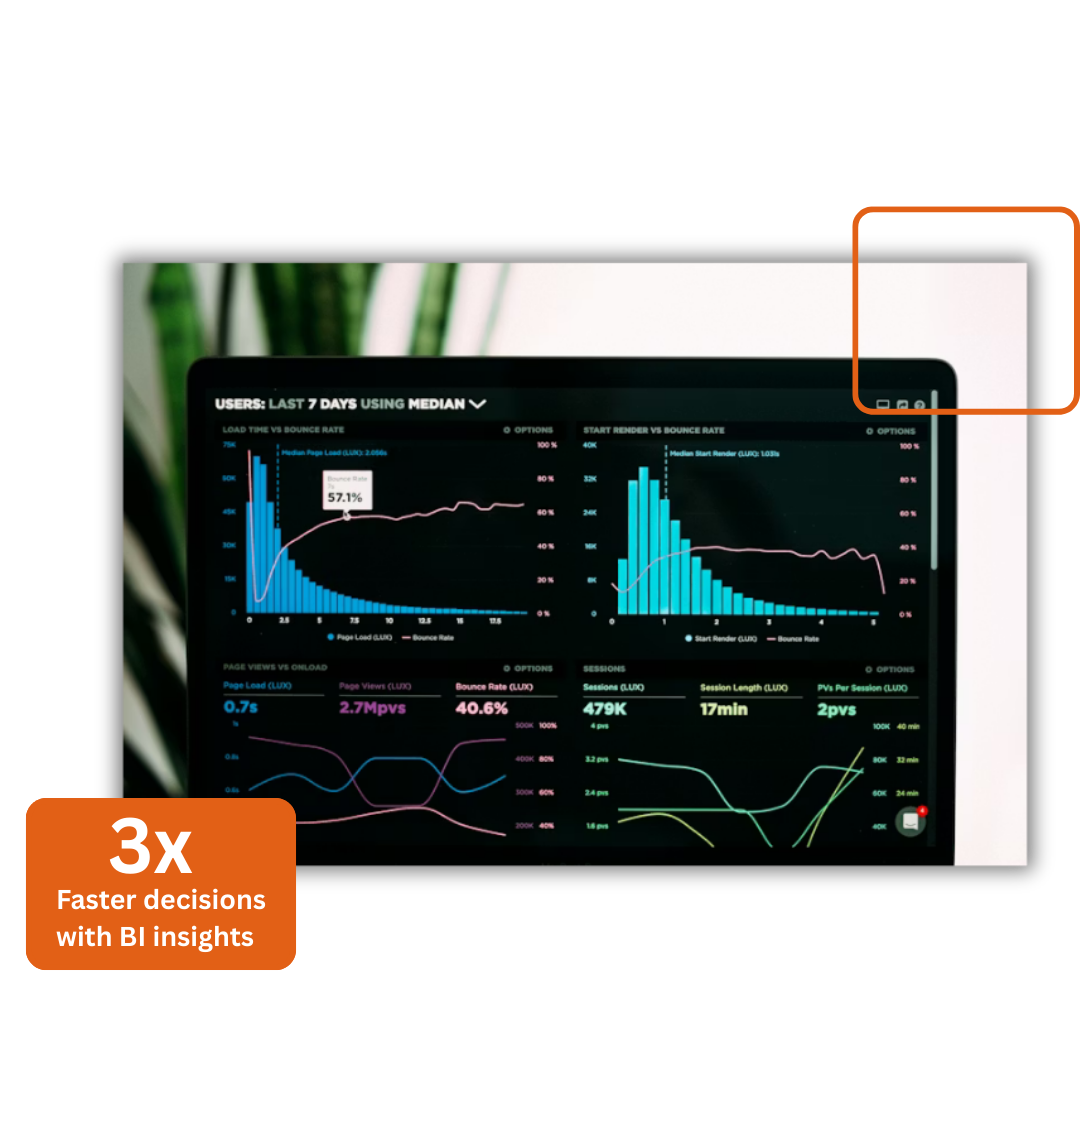
Intelligent Command Centres (Dashboards)
Instead of overwhelming users with excess data, each dashboard is structured to answer questions for specific teams. Operational performance for managers, deep analysis for analysts or high-level visibility for leadership.
- Bespoke Architecture: We use proven, industry-standard BI platforms like Power BI, Tableau and Looker that integrate with existing systems and enterprise security standards. For more specialised needs, we also build fully custom web interfaces in React and D3.js for your workflows and visualisations.
- Action-Oriented Features: Dynamic filters let users explore data on demand, real-time updates keep insights current and mobile-responsive layouts make key metrics accessible whether stakeholders are in the office or on the go.
Data Auditing & Exploratory
Analysis (EDA)
A reliable strategy needs reliable data. Comprehensive audits validate the quality & structure of your data before visualisation begins, ensuring every insight is built on a clean, consistent and analysis-ready foundation.
- Quality Assurance: We review your data for gaps, inconsistencies, duplicates and structural issues that skew reporting. Resolving these problems early improves the accuracy of all downstream analytics.
- Hidden Correlation: And beyond validation, we look beyond your data to find patterns, relationships and anomalies that might not be so obvious. This often reveals hidden drivers of performance changes, unexpected customer behaviour or emerging market shifts that need closer attention.
Predictive Modelling & Forecasting
Applying statistical & analytical models to your historical data to predict what’s next. With predictive modelling, instead of relying on past performance reports, you can plan and reduce uncertainty in strategic decisions.
- Trend Analysis: We distinguish real market signals from noise & show you whether changes are real shifts or temporary fluctuations. This transparency allows long-term planning and avoids reactive decision-making.
- Inventory & Demand Forecasting: Using historical performance, seasonality and demand patterns, we project future requirements, focusing on operational efficiency.. Such insight helps you balance stock levels, spend resources better and avoid overstocking/shortages.
Automated Reporting Ecosystems
We automate data preparation and repetitive reporting. This reduces operational overhead while keeping stakeholders informed, while also ensuring consistent data accuracy and standardized reporting across all departments.
- Scheduled Delivery: Reports are automatically generated and sent as PDF, Excel or CSV depending on your reporting frequency. Thus, stakeholders receive information daily, weekly or monthly without manual intervention.
- Smart Alerting: Our systems constantly monitor your data for defined conditions or thresholds. And when critical events happen like sudden performance drops or competitor price changes, alerts are triggered instantly by Email or Slack to allow quicker reaction and well-informed action.
The Benefits of Data Analysis & Visualisation
Effective visualisation translates multi-source datasets into intuitive intelligence, enabling stakeholders to spot opportunities and manage risks clearly. Our visual stories turn raw metrics into decision-making data where your strategy becomes fact, not guesswork.
- Instant Market Pulse: Visualise live competitor moves, price changes and inventory gaps on one screen.
- Predictive Power: Move from "what happened last month to" what will happen next week "with trend forecasting and regression models.
- Democratized Data: Give every department, from sales to procurement, access to the data they need without a data scientist having to query the database.
- Single Source of Truth: Combine internal KPIs and external web scraped data to get a holistic view of your market position.
Solving Data Challenges Across Every Sector
Retail & E-Commerce
Track competitor pricing/stock levels & product trends across thousands of SKUs.
Finance & Investment
Extract alternative data, SEC filings, and market sentiment for predictive modelling and risk analysis.
Real Estate
A compilation of real estate listings, agent details, zoning data, and historical values from hundreds of different sources.
Travel & Hospitality
Monitor live flight pricing, hotel room availability & dynamic booking rates to adjust your strategy immediately.
Automotive
Get vehicle specifications, dealership inventory, and aftermarket part pricing from global marketplaces.
HR & Recruitment
Gathering job postings, salary benchmarks, and talent profiles for recruitment platforms.
Logistics & Supply Chain
Check shipping rates, container tracking and supplier inventories to optimise operations.
Healthcare & Pharma
Track clinical trials, pharmacy pricing & regulatory changes via public health portals.
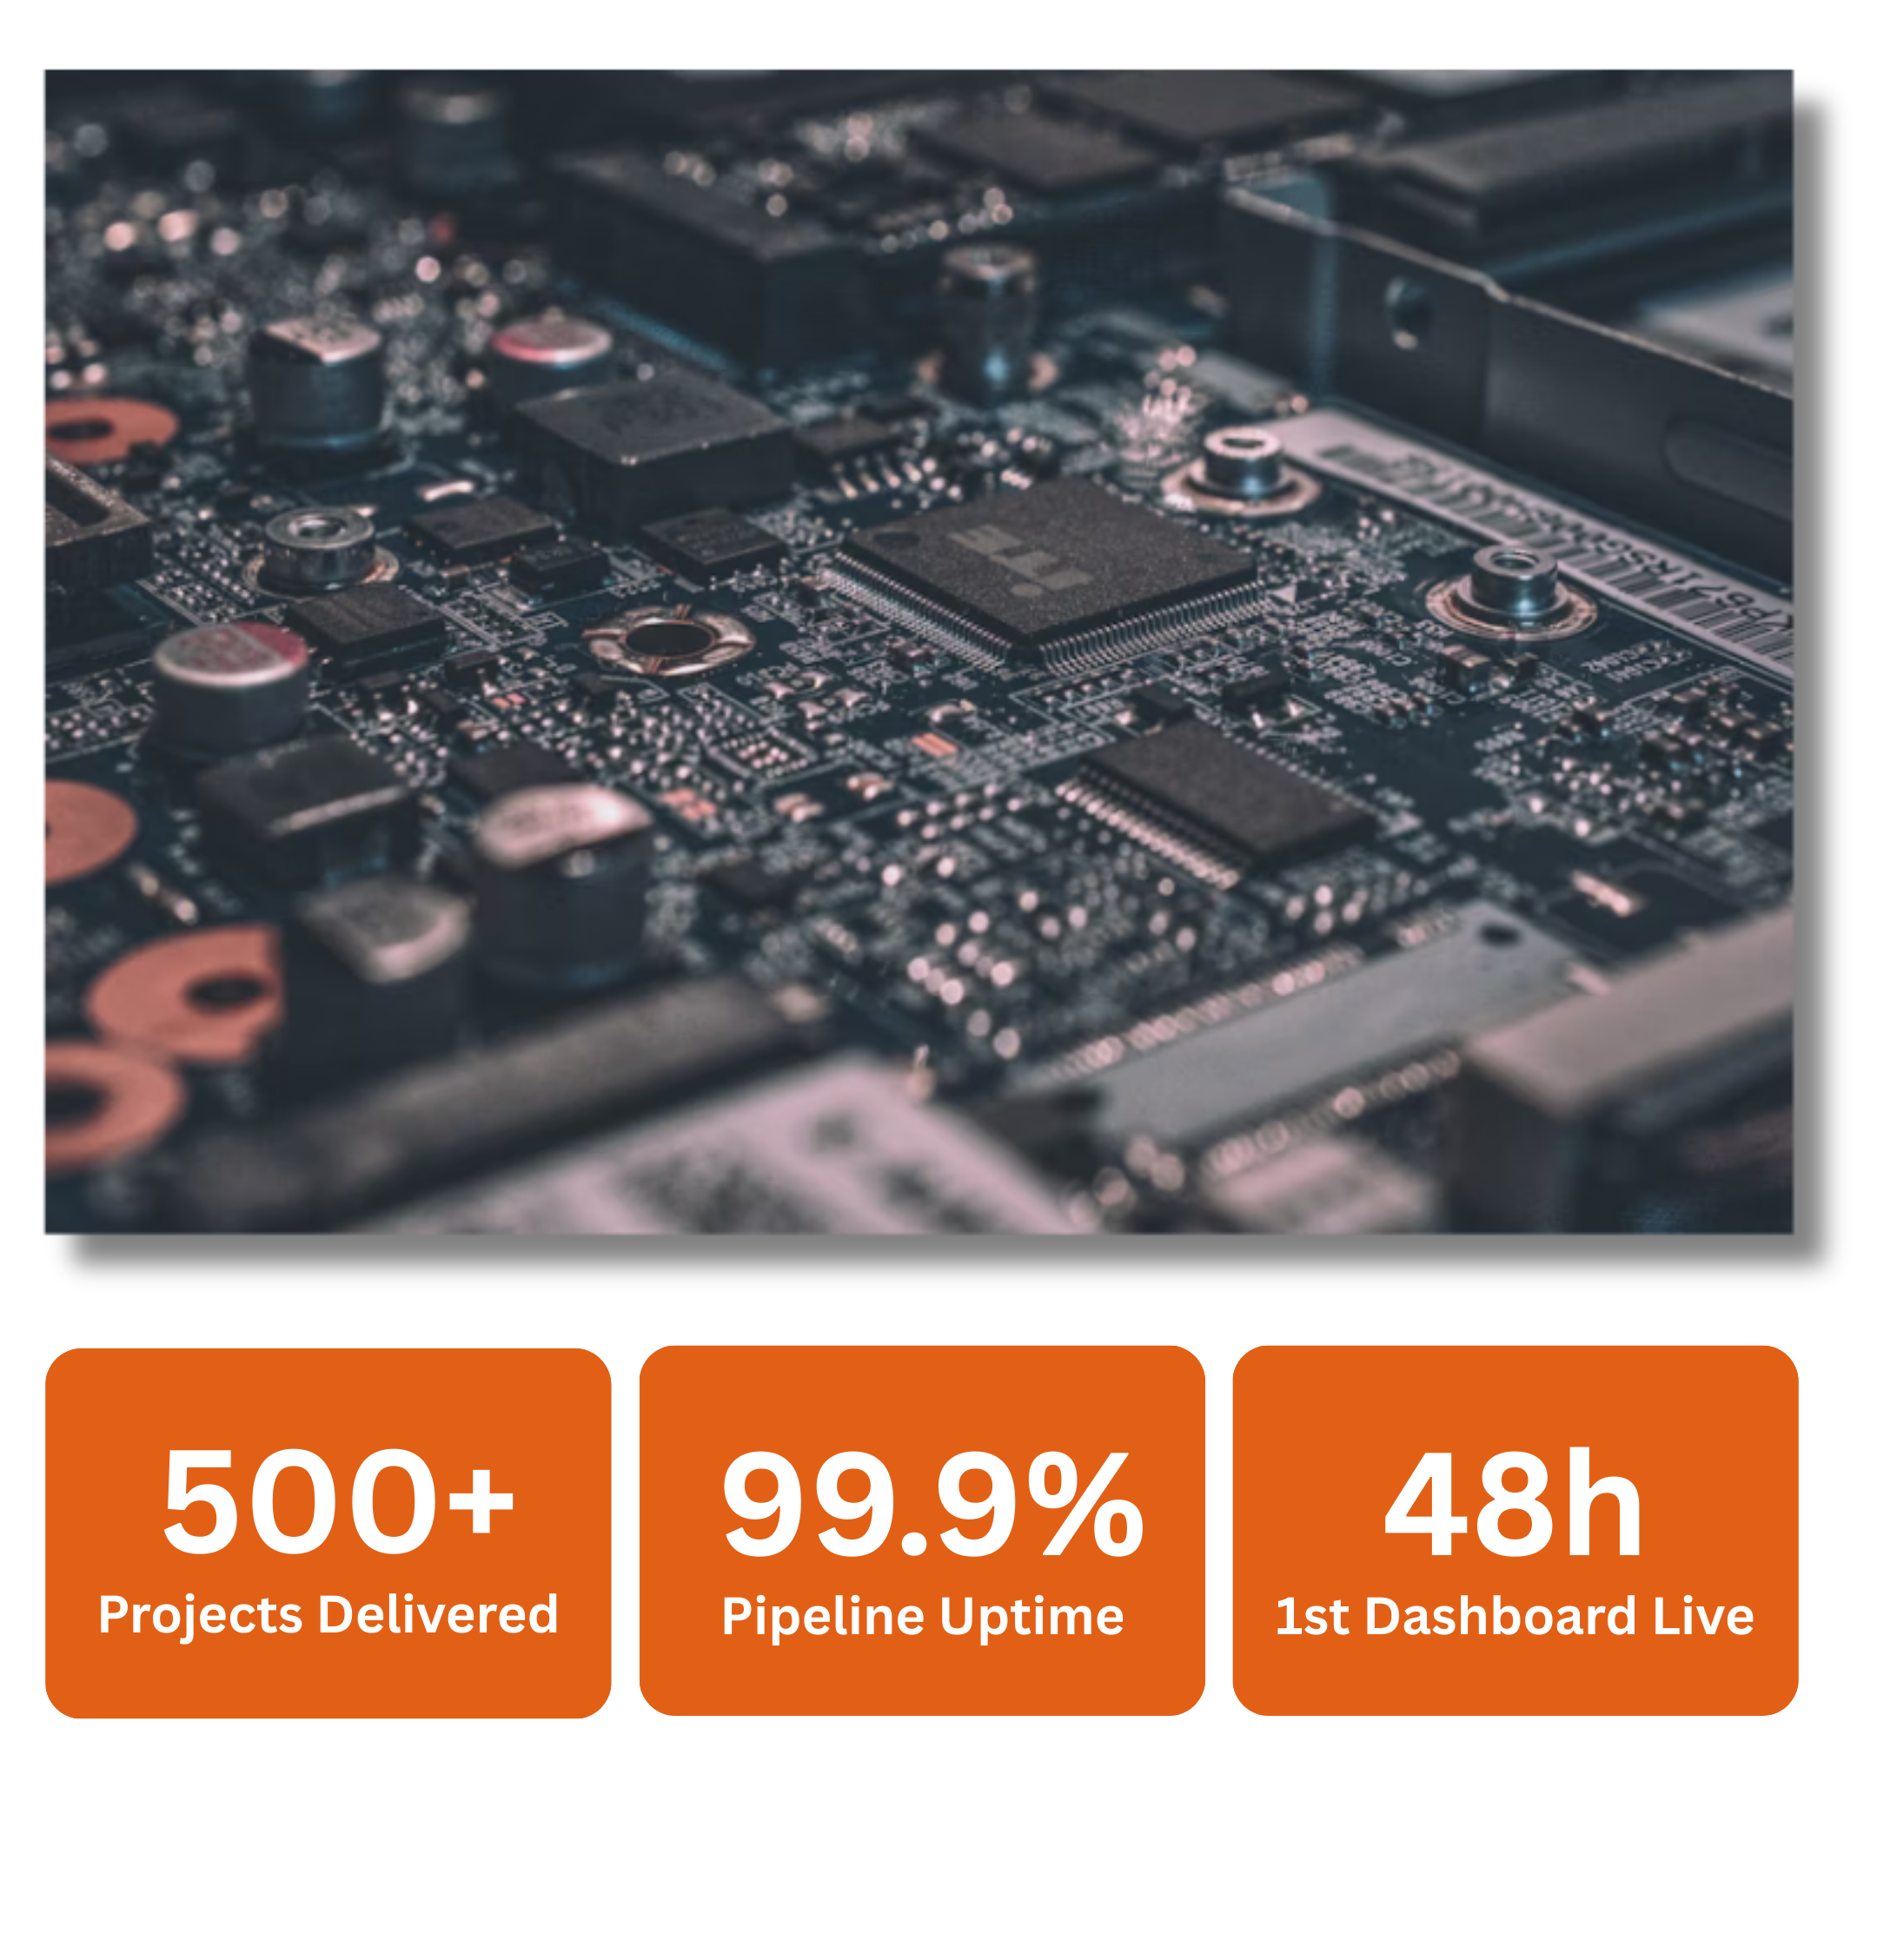
Why Choose DataSOS for End-to-End Data Infrastructure?
Most companies force you to hire one vendor to scrape the data and another to analyse it. This creates friction, data loss, and blame games. At DataSOS, we own the entire pipeline.
- Seamless Integration: Because we control the extraction, we ensure the data is perfectly formatted for visualisation from day one. No messy clean-up required.
- Engineering DNA: We build analytics platforms based on long-term performance, scalability and reliability goals.
- Cost Efficiency: Using a single partner for data collection & analytics lowers costs, friction and speeds up the delivery.
Ready to Turn Your Data into a Competitive Advantage?
Stop guessing and start knowing. Let us build the dashboard that becomes your morning coffee companion.